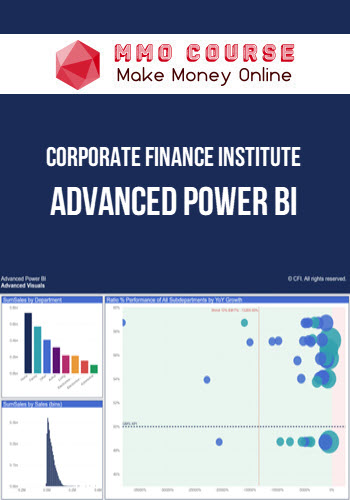
Corporate Finance Institute – Advanced Power BI
$997.00 $27.00
Total Sold: 1
Delivery: Instant Delivery
Description
Corporate Finance Institute – Advanced Power BI
In this advanced Power BI course, you’ll learn how to produce cutting-edge visuals to communicate your message, create queries, and more.
- Create professional reports with advanced visuals and interaction
- Customize data transformation and data modeling for dynamic analysis
- Integrate the capabilities of artificial intelligence and Python in Power BI
In this course, you’ll learn advanced techniques for Power BI that will help you create sleek and professional dashboards from start to finish. Over this course, you’ll be applying these techniques directly to several different retail data sets. First, with a set of existing dashboards which you’ll then enhance with better visuals and an improved user experience. You’ll then dive into Power Query; after reviewing the standard method for combining files in a folder, you’ll use those elements to create an advanced combine from a blank query.
From there, you will continue with some exploration of dynamic elements in visuals, such as user-controlled legends, colors, axes, and levels of hierarchy. You will also be working with a financial statement Power BI report, which you’ll enhance with artificial intelligence as a way to get deeper insights from the data more quickly. And finally, we’ll look at three ways to integrate Python into Power BI to extend its capabilities. By the end of this course, you’ll be extremely comfortable executing complex tasks in Power BI. You’ll have a deeper understanding of the more advanced aspects of this powerful tool, which you can use to build world-class dashboards more efficiently and with greater flexibility.
This course is perfect for anyone who would like to take their Power BI and DAX skills to the next level by exploring practical business cases. There is no better way to kick-start a career in data analysis, quantitative analysis, business intelligence, or other areas of finance with applied, practical knowledge of Power BI and related BI tools.
What You’ll Learn In Advanced Power BI?
- Produce advanced visuals that better communicate a message
- Develop a sleek, modern user experience around visuals
- Create advanced queries using custom functions, list functions, and complex columns
- Add dynamic elements to report visuals that are user-controlled
- Enhance reports with artificial intelligence functionality
- Extend Power BI functionality with Python
Delivery Policy
When will I receive my course?
You will receive a link to download your course immediately or within 1 to 21 days. It depends on the product you buy, so please read the short description of the product carefully before making a purchase.
How is my course delivered?
We share courses through Google Drive, so once your order is complete, you'll receive an invitation to view the course in your email.
To avoid any delay in delivery, please provide a Google mail and enter your email address correctly in the Checkout Page.
In case you submit a wrong email address, please contact us to resend the course to the correct email.
How do I check status of my order?
Please log in to MMOCourse account then go to Order Page. You will find all your orders includes number, date, status and total price.
If the status is Processing: Your course is being uploaded. Please be patient and wait for us to complete your order. If your order has multiple courses and one of them has not been updated with the download link, the status of the order is also Processing.
If the status is Completed: Your course is ready for immediate download. Click "VIEW" to view details and download the course.
Where can I find my course?
Once your order is complete, a link to download the course will automatically be sent to your email.
You can also get the download link by logging into your mmocourse.hk account then going to Downloads Page.
Related products
Total sold: 4
Total sold: 2


