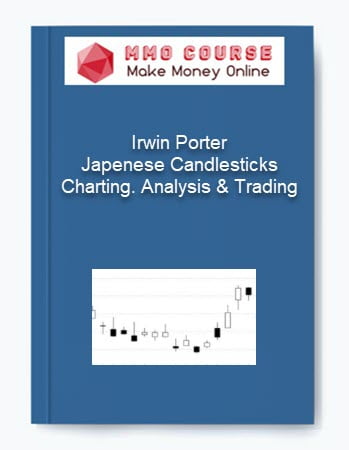
Irwin Porter – Japanese Candlesticks Charting, Analysis & Trading
$997.00 $8.00
GB Status: This product will available in 24h later after you pay.
Sales Page: N/A
Description
Irwin Porter – Japenese Candlesticks Charting, Analysis & Trading
A candlestick chart is a style of financial chart used to describe price movements of a security, derivative, or currency. Each “candlestick” typically shows one day; so for example a one-month chart may show the 20 trading days as 20 “candlesticks”.
It is like a combination of line-chart and a bar-chart: each bar represents all four important pieces of information for that day: the open, the close, the high and the low.
Candlestick charts are most often used in technical analysis of equity and currency price patterns. They appear superficially similar to box plots, but are unrelated.
Delivery Policy
When will I receive my course?
You will receive a link to download your course immediately or within 1 to 21 days. It depends on the product you buy, so please read the short description of the product carefully before making a purchase.
How is my course delivered?
We share courses through Google Drive, so once your order is complete, you'll receive an invitation to view the course in your email.
To avoid any delay in delivery, please provide a Google mail and enter your email address correctly in the Checkout Page.
In case you submit a wrong email address, please contact us to resend the course to the correct email.
How do I check status of my order?
Please log in to MMOCourse account then go to Order Page. You will find all your orders includes number, date, status and total price.
If the status is Processing: Your course is being uploaded. Please be patient and wait for us to complete your order. If your order has multiple courses and one of them has not been updated with the download link, the status of the order is also Processing.
If the status is Completed: Your course is ready for immediate download. Click "VIEW" to view details and download the course.
Where can I find my course?
Once your order is complete, a link to download the course will automatically be sent to your email.
You can also get the download link by logging into your mmocourse.hk account then going to Downloads Page.
Related products
Total sold: 2
Total sold: 10
Total sold: 5
Total sold: 4


![Simpler Trading – 10X Trade Formula Options [Complete + Indicator]](https://mmocourse.org/wp-content/uploads/2023/02/Simpler-Trading-–-10X-Trade-Formula-Options-Complete-Indicator.jpg)


