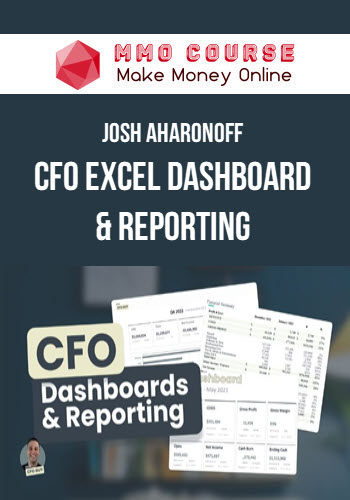
Josh Aharonoff – CFO Excel Dashboard & Reporting
$499.00 $9.00
Delivery: Instant Delivery
Description
Josh Aharonoff – CFO Excel Dashboard & Reporting
Data Organization & Visualization: Creating Engaging & Effective Financial Dashboards
MeetYour CFO Guy
Hi! I am a fractional CFO for 40+ startups, and love all things Finance & Accounting. My favorite part of my job involves building sophisticated forecasts for companies to help them understand their business better
Are you ready to impress with effective and informative financial dashboards?
- Quickly understand what’s going on with the business
- Compare changes to revenue and cost drivers over time
- Never underestimate the importance of a visually compelling presentation
- Create a concise structure for efficient reporting
- Answer key questions on the most important KPIs
- Tie it all together in Excel
The best CEOs I work with want quick insight into what matters most
This allows them to act fast in making vital decisions
Learning how to provide this data in a visually compelling way has been one of the biggest game-changers in my career.
Presenting the data is not enough – without proper design, important data points can get overlooked and messages can get confused or lost entirely.
By creating engaging and effective financial dashboards, you’ll add tremendous value to CEOs, the executive team, board of directors, and other key stakeholders.
What You’ll Learn In CFO Excel Dashboard & Reporting?
- Intro & Getting Started
- Organizing Your Data
- Creating Summarized Financials Report
- Creating Dashboards
About Josh Aharonoff
Hi! I am a fractional CFO for 40+ startups, and love all things Finance & Accounting. My favorite part of my job involves building sophisticated forecasts for companies to help them understand their business better, and I can’t wait to share this knowledge with you
Everyday I post Finance & Accounting tips on linkedin – if we haven’t connected yet, feel free to drop me a line to say hello!
Delivery Policy
When will I receive my course?
You will receive a link to download your course immediately or within 1 to 21 days. It depends on the product you buy, so please read the short description of the product carefully before making a purchase.
How is my course delivered?
We share courses through Google Drive, so once your order is complete, you'll receive an invitation to view the course in your email.
To avoid any delay in delivery, please provide a Google mail and enter your email address correctly in the Checkout Page.
In case you submit a wrong email address, please contact us to resend the course to the correct email.
How do I check status of my order?
Please log in to MMOCourse account then go to Order Page. You will find all your orders includes number, date, status and total price.
If the status is Processing: Your course is being uploaded. Please be patient and wait for us to complete your order. If your order has multiple courses and one of them has not been updated with the download link, the status of the order is also Processing.
If the status is Completed: Your course is ready for immediate download. Click "VIEW" to view details and download the course.
Where can I find my course?
Once your order is complete, a link to download the course will automatically be sent to your email.
You can also get the download link by logging into your mmocourse.hk account then going to Downloads Page.
Related products
Total sold: 6
Total sold: 4


